Abstract
This note goes through the Pulsar Maps found on the Pioneer and Voyager Spacecrafts. We will touch on how to read the pulsar map. And I will attempt to make an application to design custom pulsar maps. The inspiration of the project comes from the fact that I have been fascinated of the voyager golden record for a long time, and wanted to really understand how to read the pulsar map, and also make an updated version based on newer data.
Understanding the Pulsar Map
While doing some research, I found some very nice reads:
- Reading the Pioneer/Voyager Pulsar Map. A document trying to find which pulsars are being used in to create the pulsar map.
- Galactic Navigation using the Pioneer Spacecraft Pulsar Map. Analyzing and reading the Pulsar map. If you are interested in reading the pulsar map, I recommend checking out those pages.
Time Period
The time period that the pulsar rotational period is based on is a spin-flip found in hydrogen atoms. The spin-flip produces a frequency of 1420 MHz, which has a wavelength of cm. Which is called the 21 cm line. 1420 MHz has a time period of seconds.
Making our own Pulsar Map
Code can be found on my GitHub.
To begin with, we first need to know where to find our data from. I have found that Australia Telescope National Facility (ATNF) has one of the most complete databases when it comes to pulsars. It is also used in the documents mentioned earlier.
ATNF does not have a nice Rest API that we can access to search through the database, but someone has made a python package (psrqpy) that when imported, downloads parts of the database that can be accessed using python calls. I will use this as a backend to pass data to the application.
Backend Server
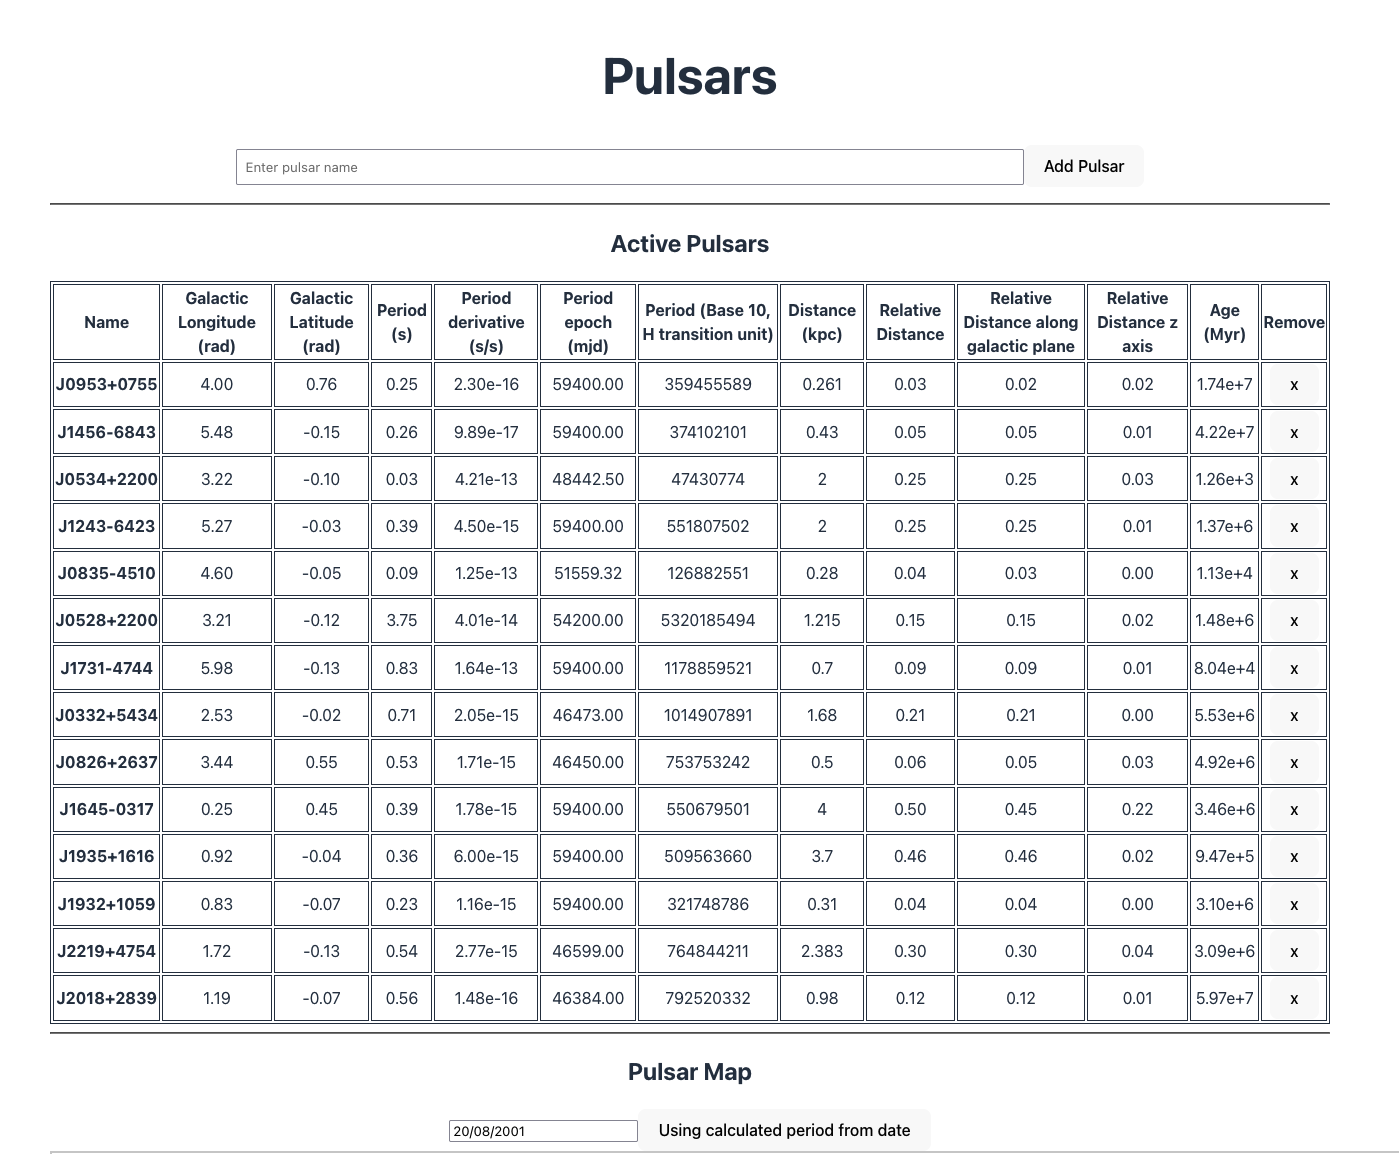
To begin with, I created a backend server using the flask module for python. The server hosts a Rest API that can be used to request data from specific pulsars. The server will respond with a JSON object containing the following parameters.
- name of the pulsar
- galactic longitude / latitude
- period given in seconds, and in number of H-transitions
- derivative of the period
- period
- distance in kpc, relative to the distance to the centre of the milky way
- relative distance along the galactic plane, and from the galactic plane to the pulsar (z-axis)
- age
Frontend
For the frontend I wanted to try some more typescript, so I found vite which was a nice tool to generate a template react application using typescript.
The frontend gives the user a input field where they can write the names of the pulsars they want to add. There is also an option to set a date, by adding a date, the pulsar-map will update with estimated pulsar-spin periods by calculating the time difference and multiplying this with the derivative of the period.
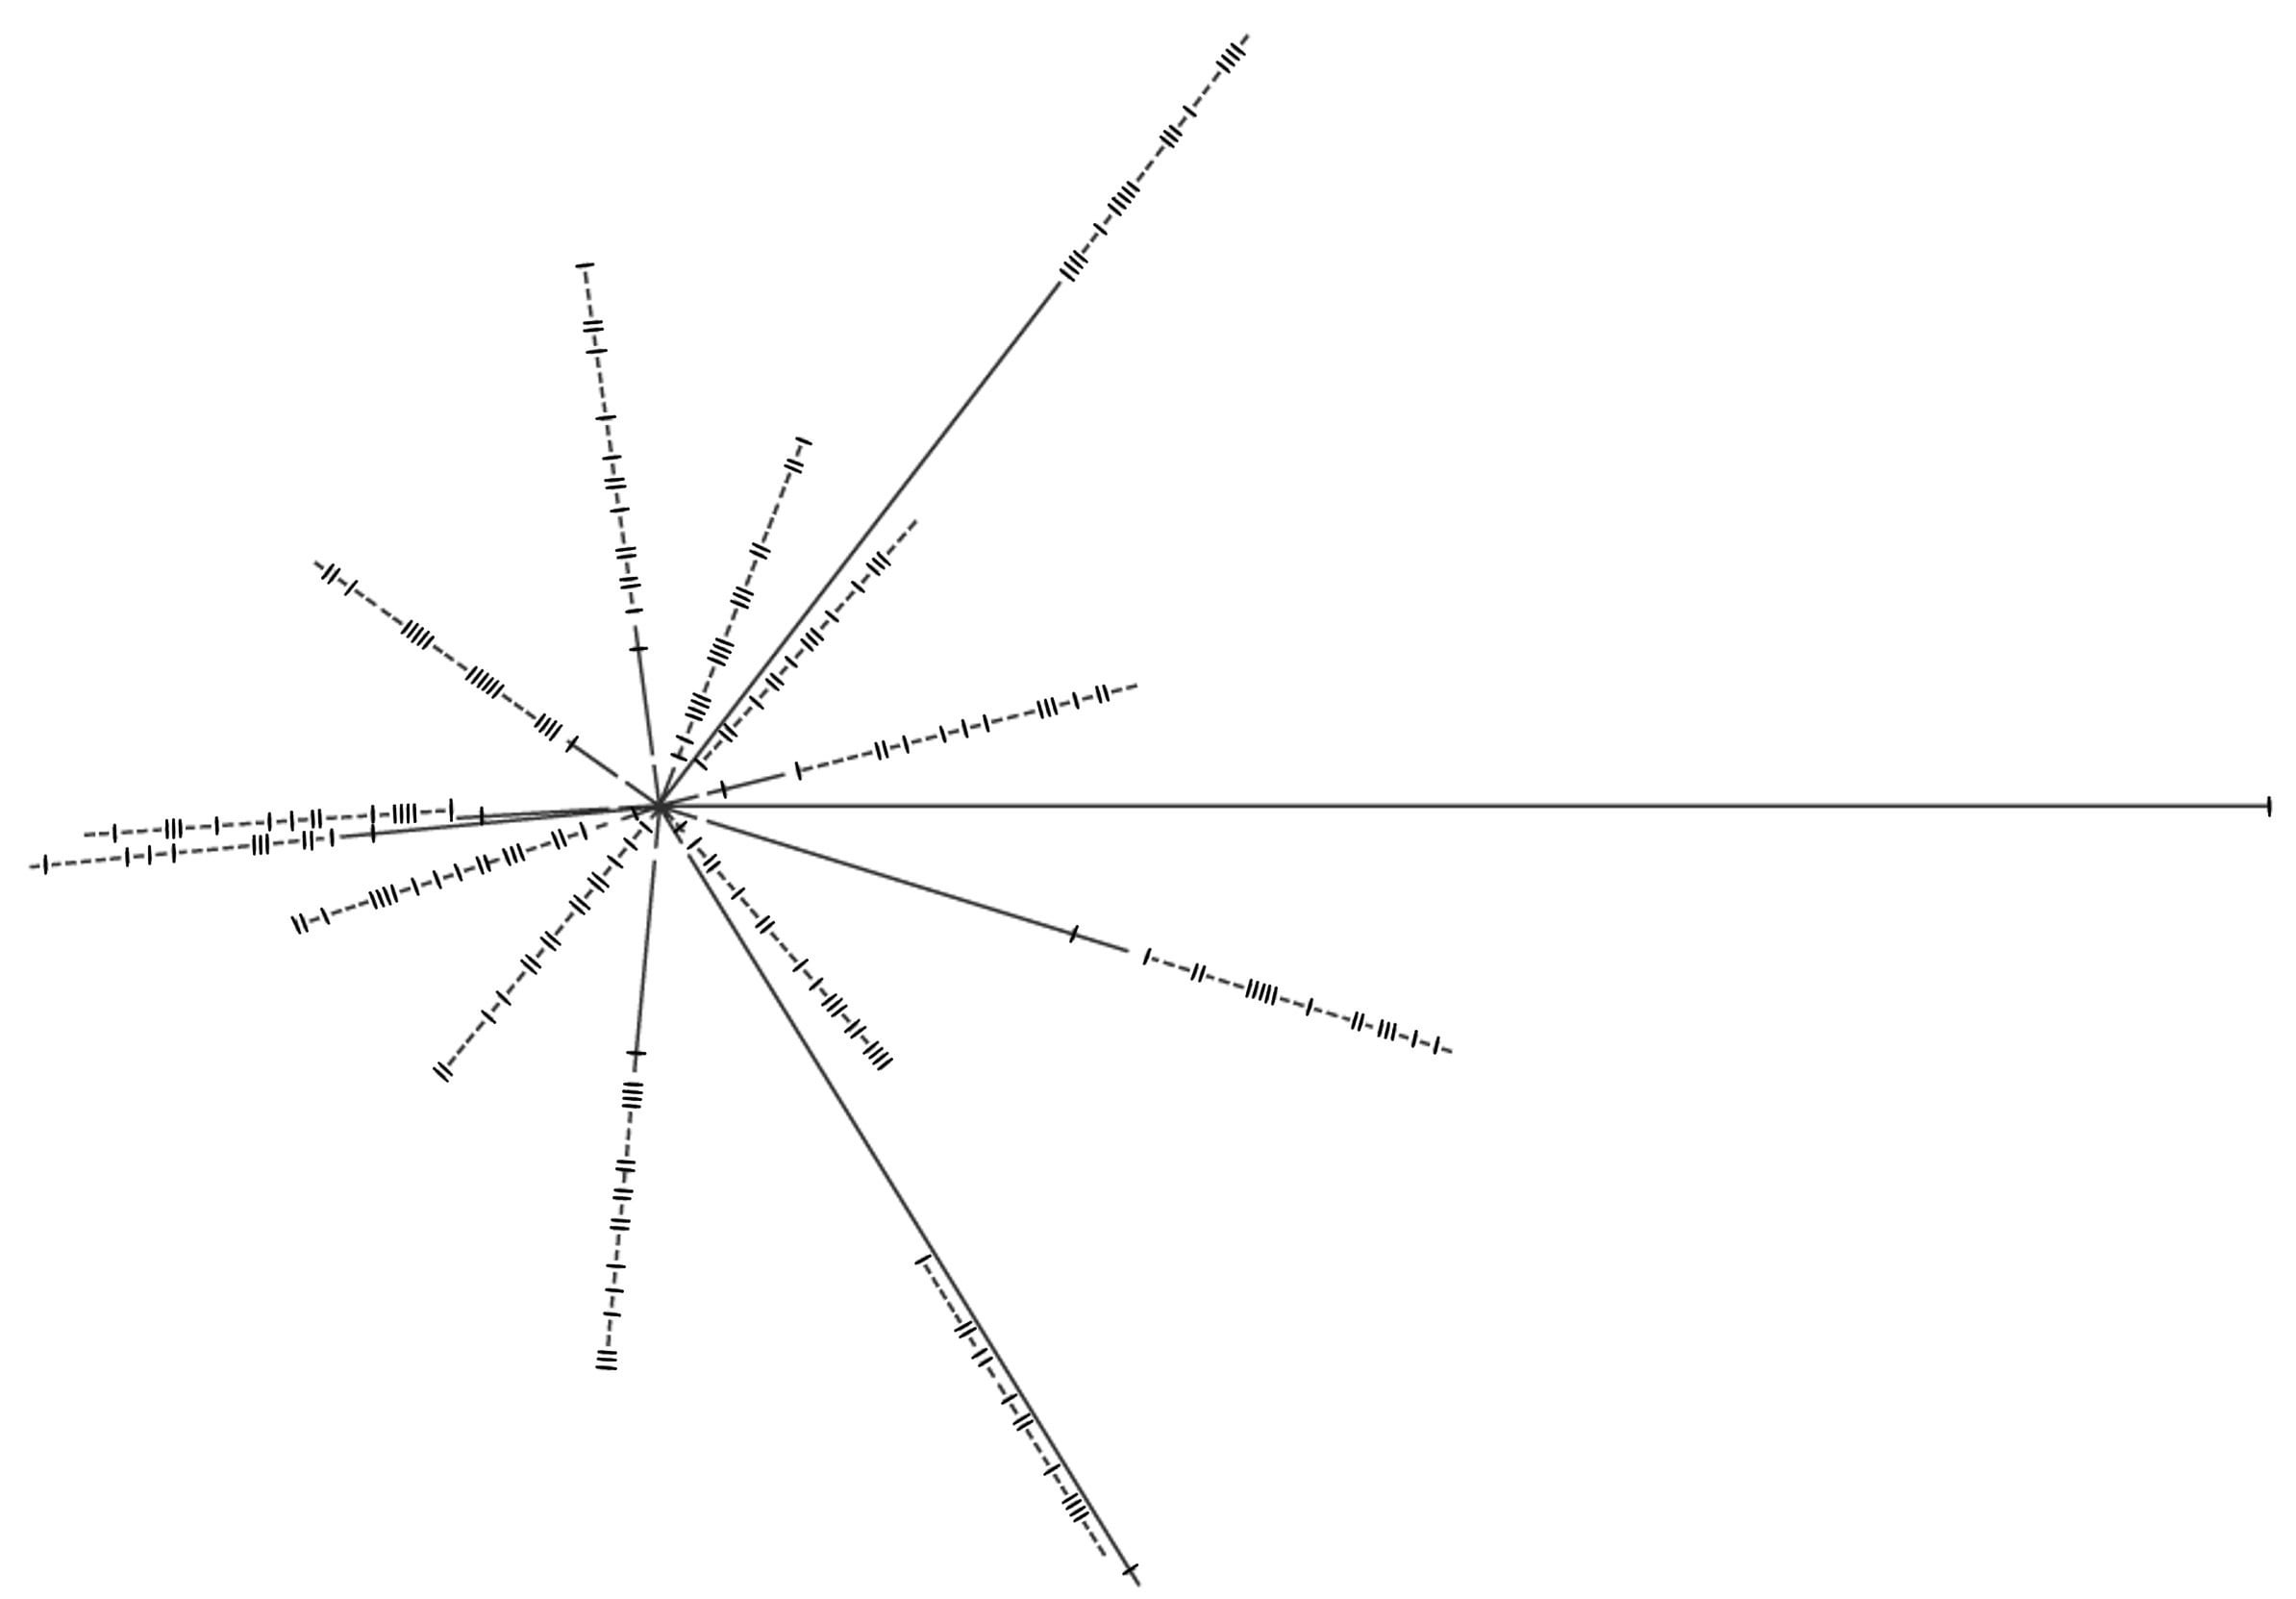
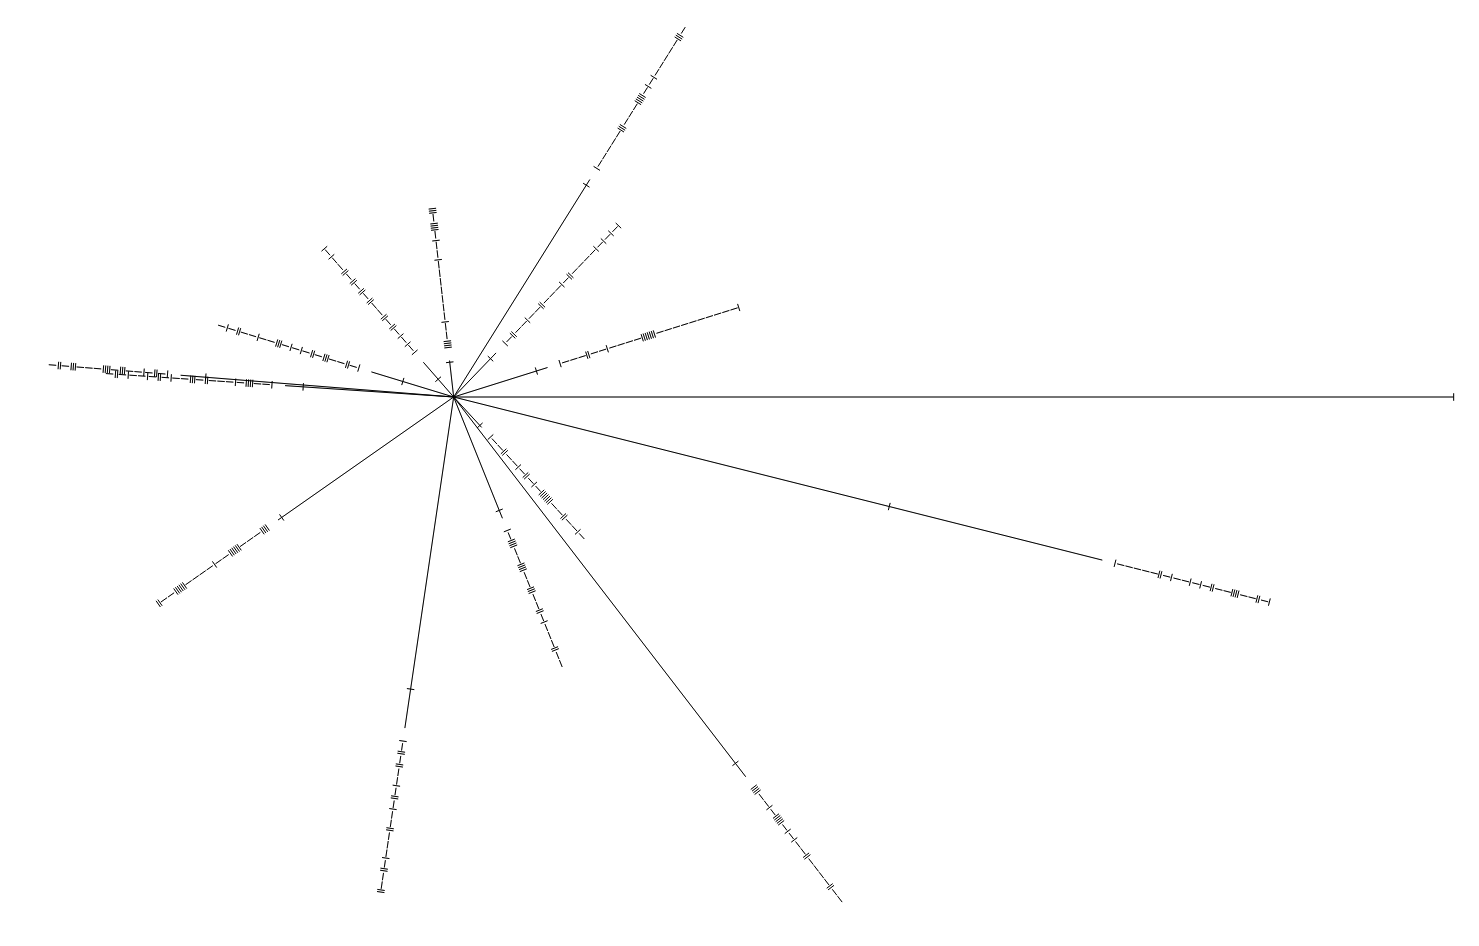
Generated pulsar map from this data:
Some formulas required
To convert from the period in seconds to period given by number of H-transitions: A hydrogen spin-flip produces radiation with a frequency of . This gives a period of .
If we have the period of a pulsar spin, we will get the period given in number of hydrogen spin-flips with the following equation:
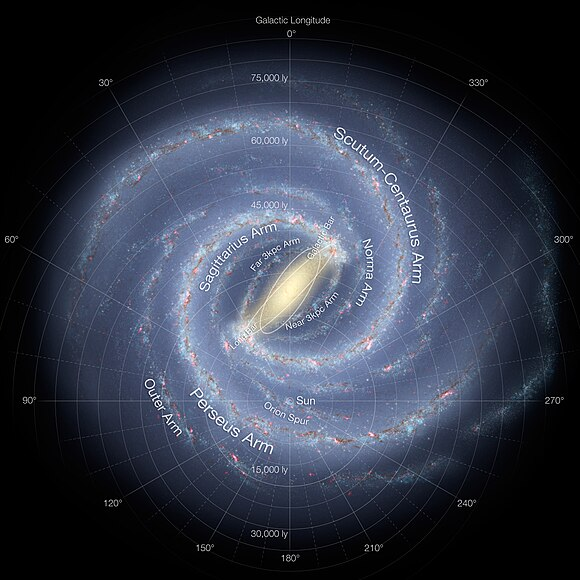
We are also interested in finding all distances in relative to the distance to the centre of the milky way. The distance to Sgr A* is approximated to be away. Meaning that we simply have to divide all distances given in kpc by 8 to get the relative distance .
The pulsars does change its period over time. I am interested in calculating the estimated period at any given time. For this, two parameters from the ATNF database is needed. The period of the pulsar rotation , the derivative and the epoch where is defined . The epoch is given in MJD time, we will need to calculate our chosen date into the same time format. After having the selected time in MJD, the calculation of the period at that time is as follows: